Location: Home >> Detail
Adv Geriatr Med Res. 2026;8(2):e260016. https://doi.org/10.20900/agmr20260016
 ,
Troy Hillier 2 ,
Nicholas Giacomantonio 3 ,
D. Scott Kehler 4,*
,
Troy Hillier 2 ,
Nicholas Giacomantonio 3 ,
D. Scott Kehler 4,*
1
2
3
4
*
Background: Frailty, an accumulation of health deficits, influences outcomes in cardiovascular disease (CVD). This study explored the relationship between admission frailty and changes in cardiovascular health indicators after cardiac rehabilitation (CR). Methods: We conducted a secondary analysis of 2322 participants referred to a 12-week exercise and education-based CR program from 2005–2015. Frailty was assessed using a 25-item index (FI); higher scores indicate greater frailty. Participants were grouped by FI (<0.20, 0.20–0.29, 0.30–0.39, 0.40–0.49, >0.50). Changes in cardiovascular indicators (e.g., blood pressure, cholesterol) were analyzed using repeated measures ANOVA, adjusting for demographics and diagnosis. Results: 2322 participants were analyzed (age: 62.3; 75.3% male). CR significantly improved systolic blood pressure, pulse pressure, and pulse rate, while reducing cholesterol and glucose. Moderate-to-severely frail participants (FI 0.20–0.49) showed greater improvements. Functional class and peak METs improved across all groups. Conclusion: CR benefits frail individuals with CVD, supporting healthy aging and improved cardiovascular health.
ADL, activities of daily living; ANOVA, analysis of variance; BMI, body mass index; BPM, beats per min; CR, cardiac rehabilitation; CVD, cardiovascular disease; FI, frailty index; GED, general educational development; HDL, high density lipoprotein cholesterol; kcal, kilocalorie; kg, kilogram; hr, hour; LDL, low density lipoprotein cholesterol; METs, metabolic equivalents; mmHg, millimeters of mercury; mmol/L, millimoles per litre; N, number; NYHA, New York heart association; SD, standard deviation; SF-36, short-form survey (36 items)
Genetics, lifestyle, and social positioning can determine the rate at which people age [1]. Age is one of the most important determinants of health and risk of acquiring illness [1,2]. Still, people age at varying rates. Frailty captures the variability and pace at which people accumulate health deficits, which can be quantified using a frailty index (FI) [1]. The FI measures the proportion of accumulated health deficits an individual has from a predefined total, presented as a ratio from 0–1. Understanding frailty can grade the risk of adverse health outcomes when compared to chronologic age alone [1,3]. Frailty may account for risk of acute illnesses [4], chronic conditions [5,6], and even mortality [7] with age [1]. Measures of health in aging, like the FI, along with healthcare interventions and improved care for social determinants (i.e., non-medical factors) have increased the longevity of adults living with illness [8]. As life expectancy rises, there is a growing number of people living with cardiovascular disease (CVD) [9–11], many of whom experience mild to severe levels of frailty [12]. Indeed, frailty among community dwellers with CVD is higher when compared those without a history of CVD [12–14]. Similar to the general, non-CVD population, frailty is a valuable prognostic factor for an array of adverse health outcomes in people with CVD [15–19], and the co-occurrence of CVD and frailty is associated with a heightened risk of morbidity [20,21] and mortality [12,16].
Secondary CVD prevention aims to reduce the burden of illness, enhance quality of life, and reduce healthcare use [12,22,23]. Currently, the gold standard for the secondary prevention of CVD is cardiac rehabilitation (CR) [24]. CR programs encompass a multidisciplinary led exercise and education based intervention, consisting of exercise therapy, smoking cessation, nutrition counseling, and medical and psychosocial management [24]. The multifaceted approach of CR interventions is a key strategy to improve healthy aging. Indeed, evidence suggests that completing CR is associated with lower frailty levels and improved long-term prognosis [12,18,25–30]. Addressing frailty in CR is also crucial because higher frailty levels are associated with reduced rates of CR completion [26,31]. Frailty is not a disease, but rather a state of health which can influence disease expression [32]. Therefore, it is worth determining if frailty is related to the degree of cardiovascular health changes observed from participation in CR. Outcomes in research and clinical practice which evaluate CR effectiveness have focussed on common cardiovascular health indicators, such as aerobic capacity, triglycerides, cholesterol, and resting hemodynamic measures [33]. However, what remains unclear is the effect of frailty on the changes in cardiovascular health metrics that are commonly measured in CR. Here, we build on our investigations in CR showing that higher admission frailty levels are associated with the greatest improvements in frailty following the completion of CR [12,26,29,34]. The purpose of this study is to test the hypothesis that higher admission frailty is associated with the greater improvements in cardiovascular health measures in CR. A secondary aim was to determine if greater baseline frailty levels were associated with improved body composition, quality of life, and diet.
We report a secondary analysis of data collected from a single CR center located in Halifax, Nova Scotia, Canada between 2005 and 2015. Our sample consisted of a total of 4004 eligible participants who were from the Nova Scotia Health central management zone. This study was approved by the Nova Scotia Health Authority Research Ethics Board.
Inclusion CriteriaEligible study participants were included if they were enrolled in CR, were >18 years of age, had experienced a cardiovascular event (e.g., myocardial infarction, percutaneous coronary intervention, heart failure) and were referred to CR by a specialist (e.g., cardiologist) through their discharge summary or from a primary care referral pathway.
Exclusion CriteriaParticipants were excluded from analyses if they did not complete CR, defined as patients who attended <70% of sessions, did not have sufficient information to estimate frailty, and non-completion of the discharge assessment at the end of CR [26]. Inclusion and exclusion criteria for the current study are also described elsewhere [26].
Cardiac RehabilitationThe CR program was a multidisciplinary intervention, which was delivered by a medical director, program lead, nurses, dieticians, and physiotherapists, and consisted of a 7:1 patient-to-staff ratio to individual participants. All CR participants received an admission consultation with CR staff prior to initiating the program. The CR intervention was a 12-week, group-based, exercise and education-based program conducted at a single community-based center in Halifax, Nova Scotia, Canada. Tailored exercise prescription was based on an individuals’ symptom-limited exercise stress test result. Sixty-minute exercise sessions were offered up to twice weekly and accompanied by weekly, 60-min educational sessions on CVD risk factor management and improving health behaviors. Exercise sessions included a 10-min warm-up and cooldown period, 40 min of aerobic exercises (e.g., continuous or interval training on a treadmill, cycle, or arm ergometer), and 10 min of resistance training using body weight exercises, resistance bands, and dumbbells to target major muscle groups. Additionally, participants received a personalized home-based exercise plan, tailored in frequency and duration to meet individual needs and exercise equipment available near or within their residence. Participants self-monitored their heart rate and perceived exertion to target moderate intensity aerobic and resistance exercises (11–13 on the Borg Rate of Perceived Exertion Scale) in each the CR intervention and home-based exercise regimens. Overall, the program aimed to mitigate CVD risk factors through health behavior modifications, including physical activity, dietary adjustments, and medication management as required.
FrailtyWe used a previously developed [26] 25-item deficit accumulation frailty index (FI) [1] created in accordance with previously published guidelines [35]. Briefly, the FI was composed of 25 variables related to cardiovascular biomarkers (triglycerides, total cholesterol, high density lipoprotein (HDL) cholesterol, low density lipoprotein (LDL) cholesterol, fasting blood glucose, diastolic and systolic blood pressure), body composition (body mass index [BMI], waist circumference, fat mass, and fat-free mass measured by bioelectrical impedance, food frequency score), and quality of life (e.g., SF-36 physical, mental, and general domains). The FI cut-offs for individual deficits were created in consultation with the CR team. All FI items were routinely collected and measured by CR staff members at CR admission and CR completion and are listed in Table S1. Each health deficit was scored on a scale from 0 (deficit not present) to 1 (deficit present). Variables in the FI with three or more possible outcomes were graded based on severity. The FI was calculated as the ratio of the health deficits present divided by the total possible health deficits. Scores range from 0–1 (e.g., 10/25 = 0.40). Higher FI scores are indicative of more severe frailty. CR participants were categorized according to admission FI levels, calculated in 0.1 increments as <0.20, 0.20–0.29, 0.30–0.39, 0.40–0.49, and >0.50. FI groups represented non-frail/very mildly frail, mildly frail, moderately frail, severely frail, and very severely frail CR participants, respectively [26].
OutcomesThe primary outcomes of interest in this study were: systolic, diastolic, and mean arterial pressure, HDL cholesterol, LDL cholesterol, and total cholesterol, pulse rate, pulse pressure, serum triglycerides, serum glucose, NYHA functional class, and peak metabolic equivalents (METs). Secondary outcomes of interest were: SF-36 physical function, SF-36 role physical, SF-36 bodily pain, SF-36 general health, SF-36 energy, SF-36 role emotional, SF-36 mental health, change in health in the last year, a food frequency indicator, percentage fat free mass, percentage body fat, BMI, and waist circumference.
Our primary and secondary outcomes were contributors to the FI. Therefore, individual outcome variables were removed from the FI for the corresponding analysis, leaving 24 items in the FI for each analysis to mitigate common method variance [36]. For example, when analyzing glucose as an outcome, we removed glucose as a contributor to the FI. Changes in traditional CR outcome measures were estimated for the entire study population, as well as within CR intake frailty groups organized by increasing levels of frailty severity (i.e., <0.20, 0.20–0.29, 0.30–0.39, 0.40–0.49, and >0.50).
AnalysisThe demographic variables included in our analyses as potential confounders were age, sex, education, marital status, employment, smoking, referring diagnosis, and admission frailty. As variables have disparate levels of missing data, complete case sets were conducted for each analysis. Adjusted repeated measures analysis of variance (ANOVA) analyzed pre-and-post estimated marginal means of cardiovascular outcomes and determined mean differences from baseline to completion of CR. Adjusted ANOVA were repeated to determine if baseline frailty and baseline frailty group at CR admission was associated with changes in traditional outcome measures, when controlling for the aforementioned confounders. Estimated marginal means and mean differences or counts (percentages) are presented as continuous and categorical variables, respectively. Adjusted logistic regression was used to determine whether the odds of creating a >0.5 MET increase in exercise tolerance differs by level of frailty; an important CR quality indicator [33]. We then examined the difference of 0.5, 1.0, and 1.5 changes in MET scores between admission frailty levels, with the least frail group (FI < 0.20) as our reference. All analyses were computed using SPSS version 29 (IBM Corp., Armonk, NY, USA).
Of 4004 CR participants, 2322/4004 (57.9%) had completed the CR program and had sufficient data available to calculate frailty scores at CR admission and completion. Overall, we observed high levels of frailty at CR admission. Most participants had mild-moderate frailty (FI: 0.20–0.39; n = 1741/2322, 74.9%) at CR admission, and 25.1% (581/2322) were in the severe to very severe frailty range. There was a greater proportion of male than female CR participants, and most participants were former smokers, were married or living with a partner, were currently on beta blockers and lipid lowering medication, had a secondary education, and were retired. Participants who were referred to CR with coronary artery disease (n = 639) and myocardial infarction (n = 646) made up most of our sample (n = 1285/2322; 55.3%). Demographic variable distribution by baseline frailty levels are displayed in Table 1. Reasons for CR non-completion have been published elsewhere; briefly, higher vs. lower admission frailty, being a smoker vs. non-smoker, being divorced/separated or widowed vs. married, having a lower vs. higher education, being unemployed vs. retired, and having a diagnosis of “other” vs. coronary artery disease were all significantly associated with CR non-completion [26].
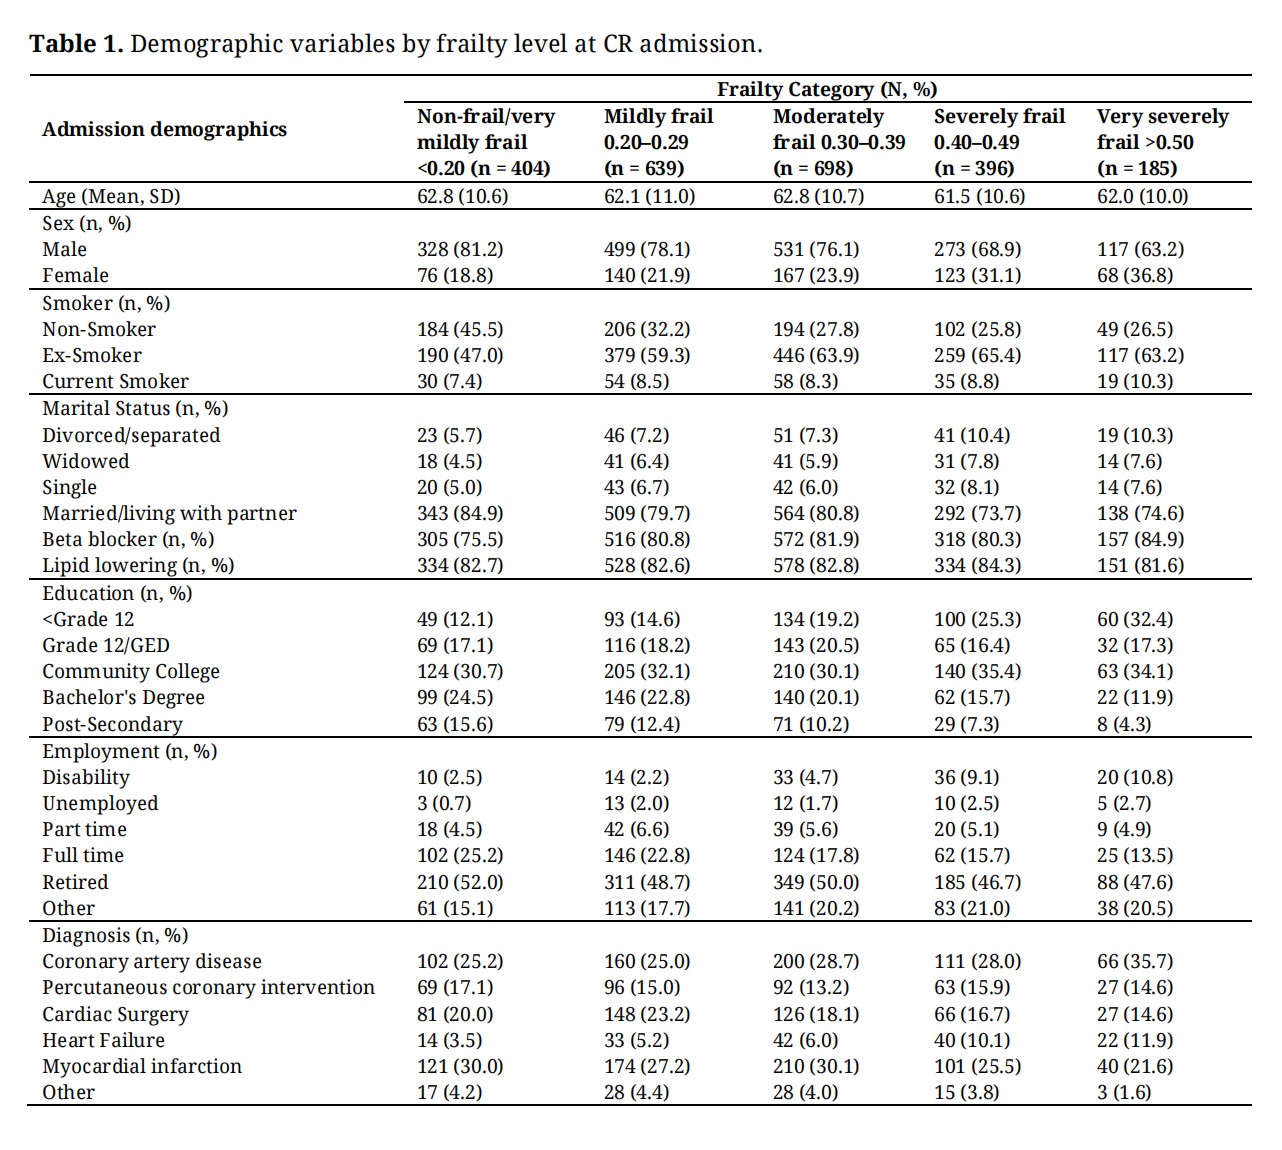 Table 1. Demographic variables by frailty level at CR admission.
Our analysis of participants who completed CR showed each of the traditional cardiovascular outcomes were significantly changed over the duration of the 12-week intervention (Table 2). For instance, mean differences of blood pressure indicators (i.e., systolic and diastolic blood pressure, mean arterial pressure, pulse rate, and pulse pressure) increased from admission to completion of the program. Blood serum indicators (i.e., total cholesterol, LDL cholesterol, triglycerides, blood glucose) were significantly lowered among our sample, apart from HDL cholesterol [37], which increased from admission to completion of CR. The NYHA functional class and peak MET scores were significantly changed with CR, such that NYHA scores decreased, and METs increased from admission to completion (Table 2).
We observed all non-traditional cardiovascular outcomes changed significantly over the duration of the program (Table 2). Individual domains of the SF-36 showed significant improvements from admission to completion of CR, while self-rated health over the past year also had a significant positive change pre-post, reflecting better health. Additionally, body composition indicators, such as fat free mass, body fat percentage, BMI, and waist circumference significantly improved from CR admission to completion.
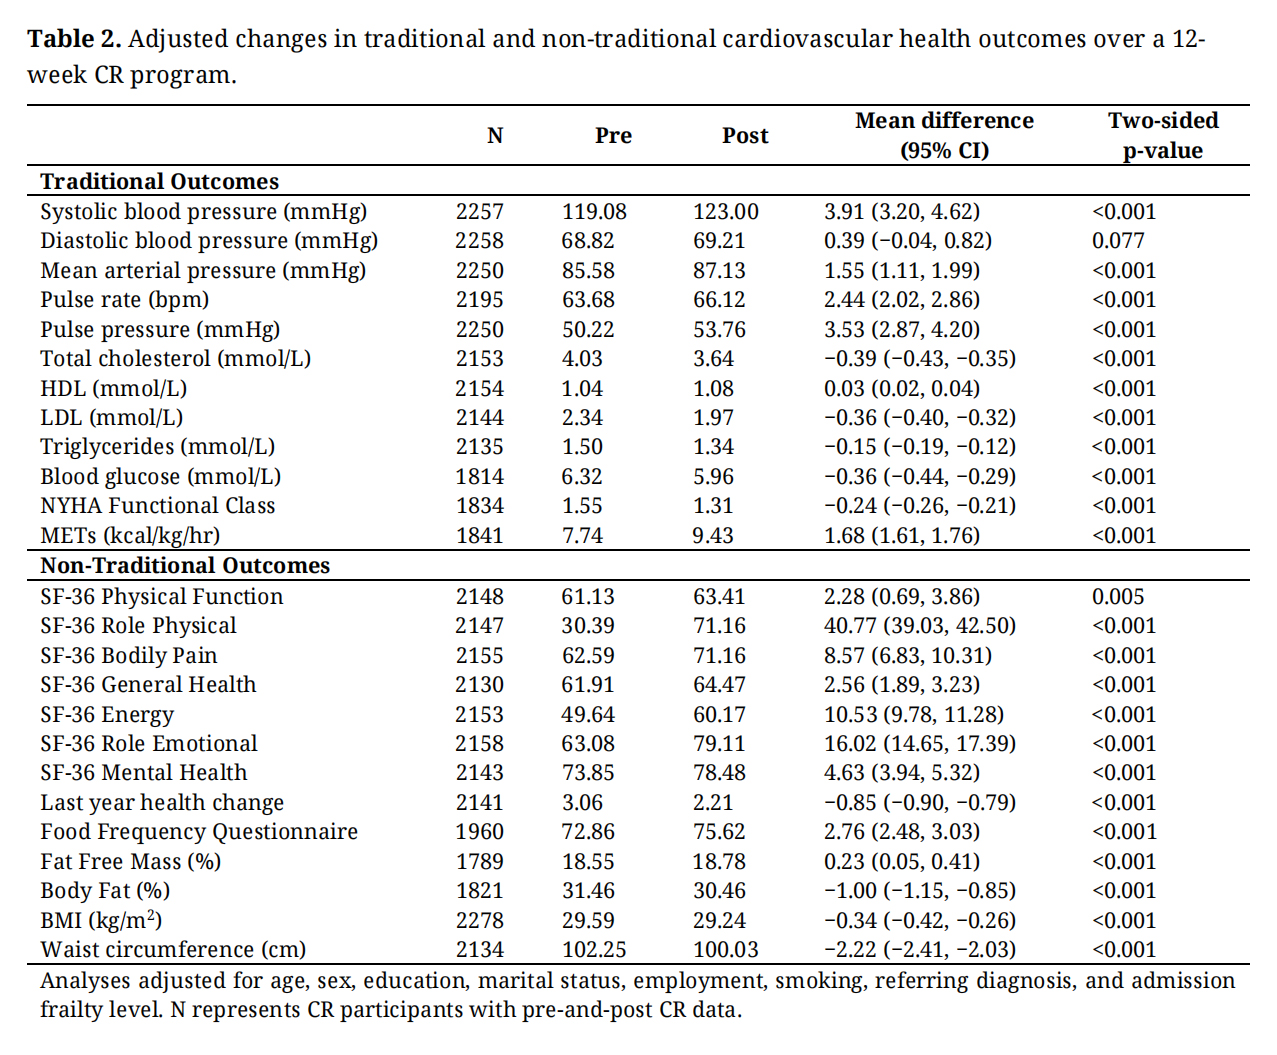 Table 2. Adjusted changes in traditional and non-traditional cardiovascular health outcomes over a 12-week CR program.
Subsequent analyses examined changes in primary and secondary outcome variables by admission frailty level (Figure 1A,B). Generally, blood pressure indicators were significantly increased in all frailty groups from admission to completion of CR. We observed no significant change in diastolic blood pressure for those who were mildly or very severely frail at admission (Figure 1A). Likewise, there were no significant changes in mean arterial pressure in the very severely frail group from admission to completion of CR (Figure 1A). All other blood pressure indicators were increased by each admission frailty group, demonstrating a significant change from admission to completion of CR (Figure 1A). Blood serum indicators had net reductions from admission to completion of CR across all levels of admission frailty, except for triglyceride (mmol/L) change in the least frail group at CR admission (FI < 0.20; Figure 1B). Generally, we observed those participants with moderate-severe frailty at CR admission (FI 0.20–0.49) had the greatest mean difference in traditional cardiovascular health outcomes in CR.
Our analysis determined NYHA functional class was significantly improved from CR admission to completion in all frailty groups (Figure 2). Specifically, mean differences in NYHA scores were greater for those who were frailer at CR admission, ranging from differences of −0.38 (95% CI, −0.52, −0.23) to −0.12 (−0.16, −0.08) for participants with FI scores of >0.50 and <0.20, respectively. Overall, we observed a reduction in NYHA scores of −0.24 (95% CI, −0.27, −0.21).
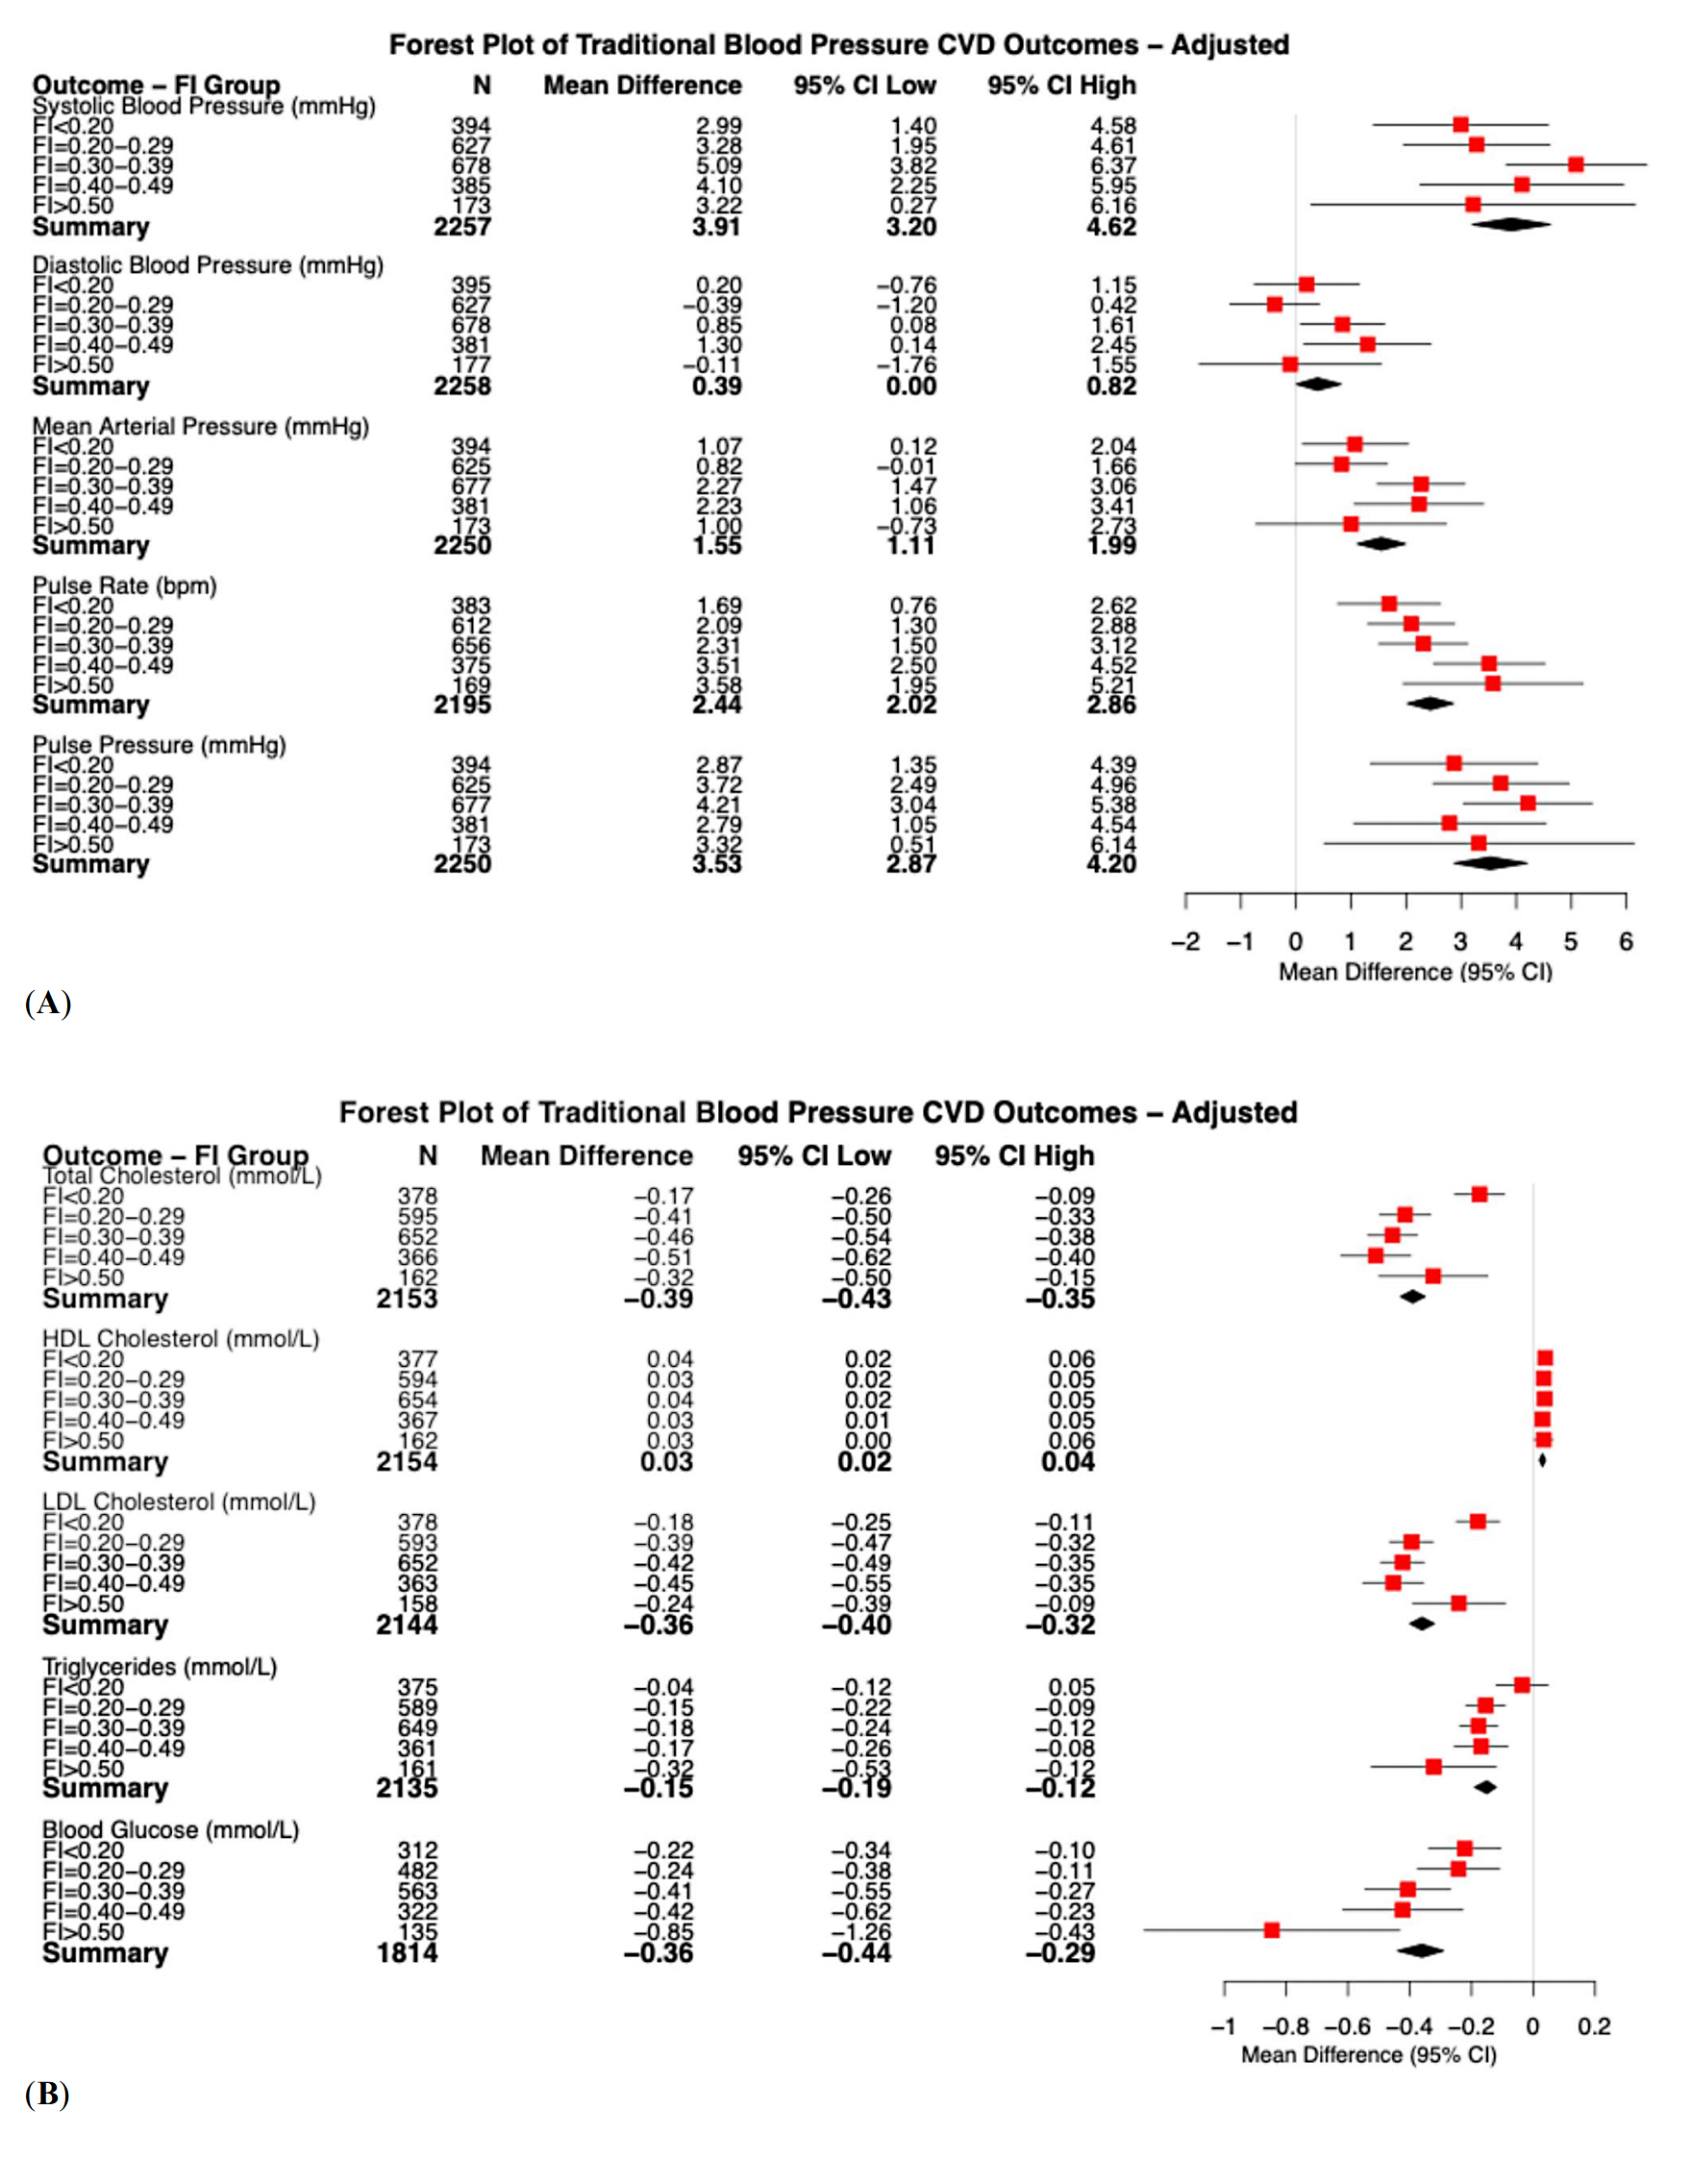 Figure 1. (A) Adjusted changes in blood pressure related variables over the duration of a 12 week CR program, stratified by baseline frailty; (B) Adjusted changes in cardiovascular related serum measurements over the duration of a 12-week CR program, stratified by baseline frailty. The red square represents the point estimate of the odds ratio with lines representing the 95% confidence interval; the black diamond represents the combined summary of the analysis.
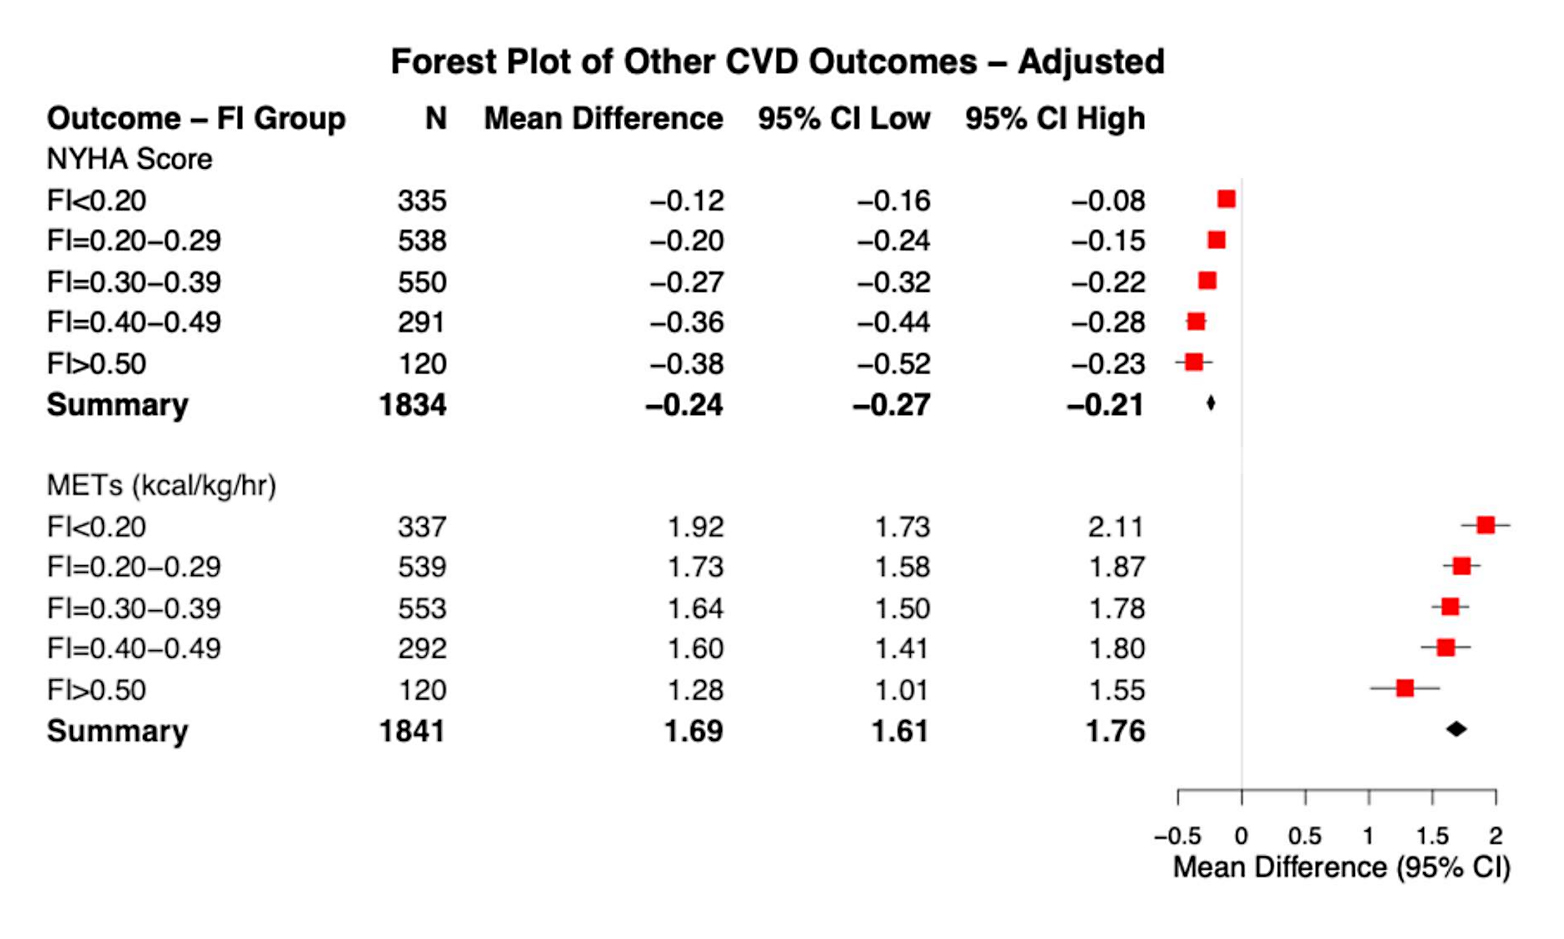 Figure 2. Adjusted changes in NYHA Scores and METs over the duration of a 12 week CR program, stratified by baseline frailty. The red square represents the point estimate of the odds ratio with lines representing the 95% confidence interval; the black diamond represents the combined summary of the analysis.
We observed significant improvements in peak MET scores over the course of CR among all frailty groups (Figure 2). Mean differences in METs were greater for participants with lower admission frailty (i.e., FI < 0.20: 1.92 [95% CI, 1.73, 2.11]). Still, those who were frailer at CR admission had an attenuated but significant change in METs. Overall, we found a mean increase in METs (summary: 1.69 [95% CI, 1.61, 1.76]) over the course of CR. Logistic regression analysis evaluated the probability of achieving MET changes of 0.5 or greater, 1.0 or greater, and 1.5 or greater over the course of CR across all admission frailty groups (Figure 3). In reference to the least frail group at admission (FI < 0.20), we generally observed no significant differences in the likelihood of achieving a 0.5–1.5 or greater MET change from admission to completion of CR. However, all CR participants with admission frailty levels greater than 0.20 were less likely to see a 0.5–1.5 or greater change in METs (Figure 3). In reference to the least frail group at admission (FI < 0.20), MET changes of 0.5 or greater were significantly less likely for participants with an admission FI of 0.20–0.29, while MET changes of >1.5 were significantly less likely for those with an admission FI of 0.40–0.49 (Figure 3). No other significant MET change differences were observed.
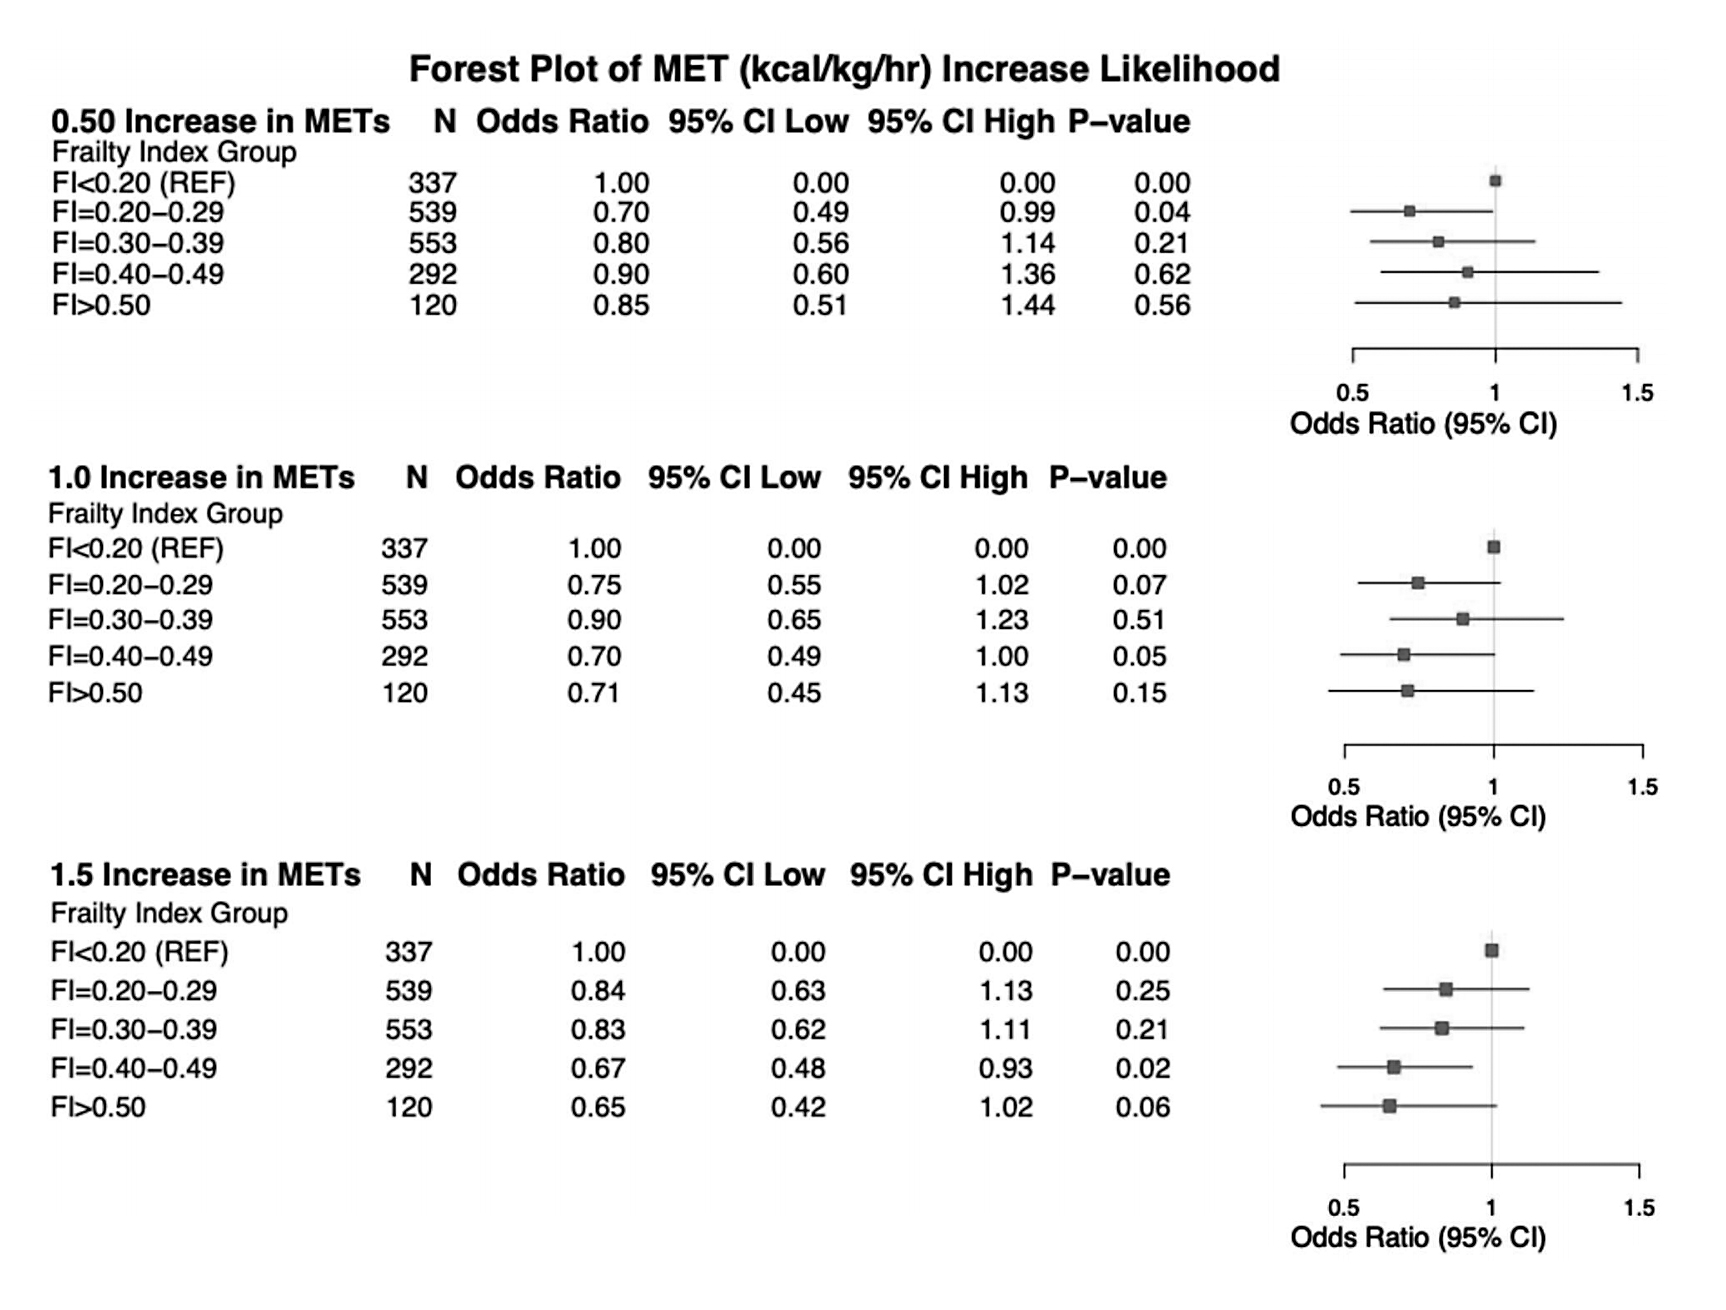 Figure 3. Odds ratios for 0.5, 1.0, and 1.5 or greater MET increases in exercise tolerance from admission to completion of CR. The red square represents the point estimate of the odds ratio with lines representing the 95% confidence interval.
The purpose of our study was to examine the association between admission frailty and changes in traditionally and non-traditionally measured cardiovascular health metrics from baseline to completion of CR. Here, we observed increases in hemodynamic measures following the completion of CR in all frailty groups. Furthermore, CR was associated with other variables related to cardiovascular health, an improvement in quality of life, and body composition. Although there were generally similar improvements observed among participants with different admission frailty levels, frailer participants at CR admission were associated with supplemental improvements in cholesterol and glucose profile. These findings suggest that while CR was beneficial across all frailty levels, individuals with greater frailty at admission may experience unique metabolic advantages from participating in CR, highlighting the potential for inclusive interventions with beneficial outcomes in frail participants from very mild to very severe.
At CR completion, all participants observed an increase in hemodynamic measures of cardiovascular function irrespective of frailty level (Table 2; Figure 1). We posit that blood pressure medications may have been adjusted following an acute cardiovascular event, or lowered the dosage in consequence to improvements with hemodynamics related to exercise training. Medication use (e.g., beta-blockers, lipid-lowering therapies) may have influenced participant outcomes and interacted with the effects of CR. The observed changes likely reflect the combination of medication and lifestyle behavior changes rather than CR alone. However, the influence of medication adjustments was not captured in the present study. For most people with adverse cardiovascular health, elevated hemodynamic changes in blood pressure pose an increased risk of mortality and health complications [38]. Hypertensive control is therefore an appropriate course of cardiovascular rehabilitation and management [38]. However, the relationship between frailty and hypertension on elevated adverse health outcome risk is conflicting [39–41]. Previous research shows the combination of elevated blood pressure and frailty traits [42], such as reduced grip strength [40] and slower walking speed [43], did not share the same cardiovascular mortality risk observed among healthier study participants [39,40,43]. Moreover, meta-analytic evidence demonstrates mortality risk was not elevated among frail adults with higher blood pressures [41]. These data suggest that the conventional approach to hypertensive management may warrant reconsideration in frail populations, as elevated blood pressure might not confer the same mortality risk and could, in some cases, be protective. This line of inquiry remains to be explored in the CR setting and is worthy of investigation.
Our analysis of changes in traditional blood serum indicators (Figure 1B) demonstrated that frailer CR participants observed a greater magnitude of significant improvements than robust counterparts. In conjunction with improvements to HDL cholesterol profiles across frailty levels, we also observed significantly reduced levels of total cholesterol, low-density lipoprotein cholesterol, triglycerides, and blood glucose, aligning to previous investigations [44,45]. An important finding is the significant reduction in blood glucose, which was notability greater among CR participants who were frailer at admission (Figure 1B). Chronically elevated blood glucose levels negatively influence a milieu of physiologic systems [46], including cardiovascular health, that give rise to frailty [47]. Concurrently, we note the frailest participants will be the most vulnerable to adverse health outcomes, and therefore view the reduction in blood glucose observed among our sample as an added benefit to overall health and frailty status. We recognize the dichotomy between elevated blood pressure indicators and reduced and blood serum indicators may result from the combination of lifestyle and medication adjustments [48]. adopted during the course of a 12-week CR program. However, our investigation was not able to isolate the effects of the multiple components of CR that were related to changes behind blood pressure and serum glucose and cholesterol changes, which requires further examination from future research.
Physical fitness was improved despite the degree of frailty (Figure 2), although improvements were attenuated among the frailest (Figure 3). Peak METs achieved on a symptom-limited exercise test are a key indicator of physical capacity and reflect the metabolic demand required for activities of daily living (ADLs) [49]. The observed increase in METs suggests that frailer individuals can enhance their functional capacity which holds promise to ease the metabolic requirements of daily tasks such as light house work, gardening, and physical activity [49]. Improvements in peak METs are a recognized quality indicator in CR programs [50,51] and play a crucial role in maintaining long-term cardiovascular health, serving as a benchmark for CR success. However, when assessing MET changes by admission frailty, we found that individuals with severe frailty were less likely than healthier participants to achieve improvements of 0.5–1.5 METs or greater (Figure 3). This finding warrants investigation into integrating frailty into standard program approaches as a strategy to optimize functional gains in the most frail.
Clinical ImplicationsThe findings of this study have important implications for CR, particularly in considering frailty at admission, throughout the intervention, and upon completion. The observed contrast between improvements in cholesterol, glucose, and peak METs, with elevated resting hemodynamics among frailer participants suggests the need for personalized CR strategies and further research. Future investigations could explore tailored interventions that address the unique physiological limitations of frailer individuals, such as exercise regimens targeting more aggressive hypertensive management, to determine whether reducing blood pressure confer additional benefits while preserving key CR adaptations that support ADL independence. Given the conflicting evidence on hypertensive interventions in frail populations, health professionals should carefully weigh the cost-benefit of prioritizing exercise capacity (peak METs) as a more favorable CR outcome for individuals with greater admission frailty. Future research should explore mechanisms behind these differential responses to optimize CR programs admission frailty. Lastly, we advocate for the inclusion of individuals in CR despite their frailty level, as the benefits observed in this study suggest that participation can alleviate cardiovascular disease burden. Thus, we recommend routine frailty assessment at CR admission to enhance treatment decision-making and long-term prognosis.
LimitationsThis study has limitations to acknowledge. First, the sample sizes for traditional cardiovascular health indicators were varied, which increases the risk for sampling bias, influences the statistical power of certain analyses, and affects the generalizability of our findings. However, we had a substantially powered sample of CR participant data for each analysis, with the lowest count of n = 1814 (i.e., blood glucose). However, the complexity of CR participants underscores the need for caution when interpreting results for indicators with smaller sample sizes. Second, the inclusion of multiple comparisons across traditional and non-traditional variables increases the potential for misguided conclusions due to the risk of Type I errors. However, the majority of p-values in our analyses were below 0.001 (Table 2), providing confidence in the significance of the observed changes. Third, we estimated frailty using a 25-item FI, which is five variables fewer than previously published guidelines [3]. However, the same 25-item FI has been used previously among CR participants with predictive validity of frailty [26]. Lastly, the data we analyzed in this study was collected during 2005–2015 and may not fully reflect the current practices of CR; analyses of current CR programs and models are needed to confirm our findings.
We highlight the role of frailty in moderating health outcomes during CR. Frailer participants showed significant improvements in some cardiovascular health indicators, such as reduced blood glucose and lipid profiles, METs, and NYHA scores, but had inconsistent changes in blood pressure changes, and attenuated benefits in MET change by admission frailty severity. Our findings suggest there are potential but varied benefits of CR participation for all levels of admission frailty and expression of cardiovascular diseases. Future research should further refine CR approaches for diverse levels of admission frailty.
The study was approved by the Institutional Review Board (or Ethics Committee) of the Nova Scotia Health Authority Research Ethics Board (protocol code: 1023328; May 22, 2018). Regarding the Informed Consent Statement, informed consent was obtained from all subjects involved in the study.
Declaration of Helsinki STROBE Reporting GuidelineThis study adhered to the Helsinki Declaration. The Strengthening the Reporting of Observational studies in Epidemiology (STROBE) reporting guideline was followed.
The following supplementary materials are available online, Table S1: FI variables used at CR admission and completion.
The dataset of the study is available from the authors upon reasonable request.
EM: Data curation; Formal analysis; Investigation; Methodology; Software; Validation; Visualization; Roles/Writing-original draft; and Writing-review & editing. TH: Conceptualization; Data curation; Formal analysis; Investigation; Validation; Visualization; Roles/Writing-original draft. NG: Conceptualization; Investigation; Project administration; Supervision; Validation. SK: Conceptualization; Formal analysis; Investigation; Methodology; Project administration; Resources; Supervision; Validation; and Writing-review & editing.
The authors declare that they have no conflicts of interest.
No funding was provided for this research.
We acknowledge and thank our colleagues at the Hearts and Health in Motion Cardiac Rehabilitation Centre at Nova Scotia Health for their collaboration in this research.
1.
2.
3.
4.
5.
6.
7.
8.
9.
10.
11.
12.
13.
14.
15.
16.
17.
18.
19.
20.
21.
22.
23.
24.
25.
26.
27.
28.
29.
30.
31.
32.
33.
34.
35.
36.
37.
38.
39.
40.
41.
42.
43.
44.
45.
46.
47.
48.
49.
50.
51.
MacEachern E, Hillier T, Giacomantonio N, Kehler DS. The Impact of Frailty on Cardiovascular Health Change in Cardiac Rehabilitation. Adv Geriatr Med Res. 2026;8(2):e260016. https://doi.org/10.20900/agmr20260016.

Copyright © Hapres Co., Ltd. Privacy Policy | Terms and Conditions


